


You have a technology team managing the day-to-day. But when you sit in a board meeting or a budget review and someone asks whether that investment is actually working — you are piecing together the answer from multiple sources, trusting what you are told, or admitting you do not have a complete picture.
That is not a failure of management. It is an intelligence gap. And it exists because the tools to see it clearly have never existed — until now.
OpixIQ closes that gap. Here is how it looks from where you sit.
Role-Based Intelligence
Your view. Your priorities.
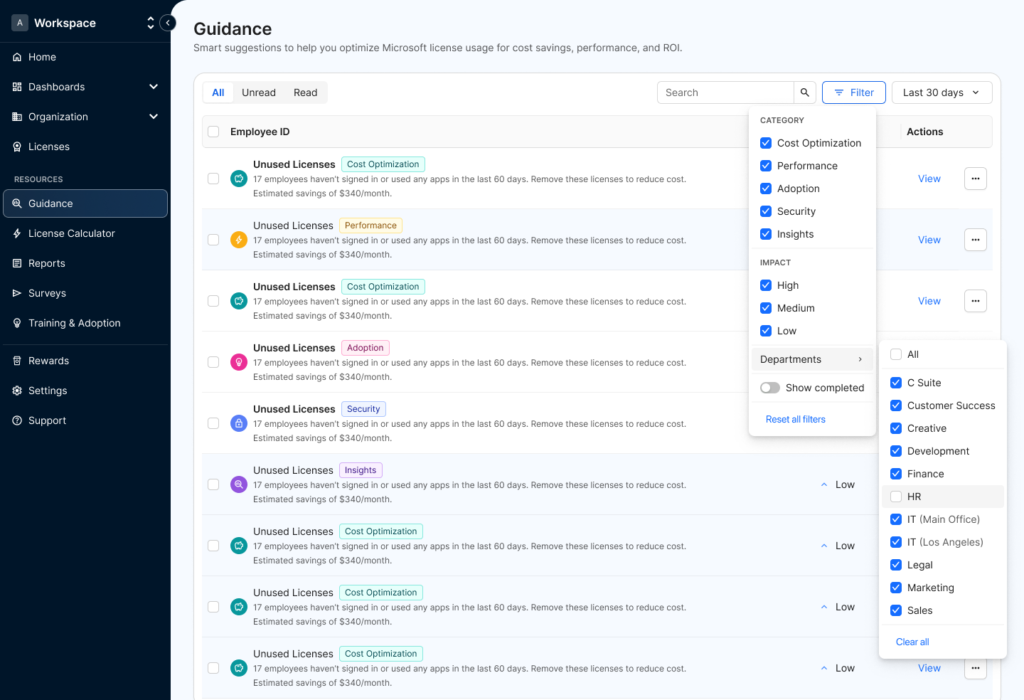
Guidance and Decisions.
What to do next and why.
Utilization and Adoption
It is actually being used.
Resource Assignment
The right tools for the right people.
Every executive in your organization has a different relationship with this data. A CFO needs to see financial performance. A CIO needs to see strategic alignment. A COO needs workforce productivity. An IT Director needs operational detail. OpixIQ delivers a purpose-built dashboard for each — so nobody is translating someone else’s report to find their answer.
When every decision-maker has the view built for their role, Microsoft investment stops being an IT conversation and becomes a business conversation.
Strategic alignment, technology performance, license usage trends, and Copilot readiness. The view that connects IT investment to competitive capability.
Budget variance, cost per employee, spend analysis, ROI index, and upcoming renewals. The view that connects Microsoft spend to financial performance and return.
Workforce productivity, adoption trends, and training needs for the COO. License efficiency, assignment detail, and utilization depth for the IT Director.
Data without direction is just more noise. OpixIQ’s guidance engine looks across all your data — assignments, utilization, spend, and engagement — and surfaces specific recommendations with impact scoring. Not alerts. Not reports. Decisions that are ready to act on.
Good decisions naturally correct inefficiency. When the right decisions get made consistently, waste is eliminated and the return on your investment improves — not as a goal, but as a result.
Unused and underutilized resources
Employees inactive 60+ days — flagged with estimated monthly savings.
Copilot readiness gaps
Employees ready for Copilot based on utilization data — not yet assigned.
Training and capability gaps
Low utilization that signals a training need rather than a resource problem.
Compliance and standardization
Allocation deviations flagged before they become audit or compliance issues.
Assigning the right resource is only half the picture. OpixIQ tracks how those resources are actually being used — adoption rates, workload engagement, and individual efficiency scores — so you know whether your investment is working at the employee level, not just on paper.
Low adoption is not just a technology problem — it is a productivity problem. Identifying it early means addressing it before it compounds across hundreds of employees.
Adoption rates across every Microsoft 365 workload — Teams, Exchange, SharePoint, OneDrive, Power BI — at the organization, department, and individual level.
Each employee receives an efficiency rating — from non-user to power user — giving a clear signal of where engagement is strong and where it needs attention.
When utilization is low, OpixIQ distinguishes between a fit problem — the wrong resource — and a capability problem — the employee needs training to use what they have.
Most organizations assign Microsoft resources based on requests, habits, or decisions made years ago that nobody has revisited. OpixIQ maps every assignment to roles — so what each person has reflects what their job actually requires, and every new hire or role change follows the same intelligent standard.
When assignments align to roles, the silent waste of unused resources is eliminated naturally — and the investment recovers without cutting anything that matters.
OpixIQ builds a matrix of what each role in your organization needs. Every assignment is measured against that standard — flagging misalignment automatically.
Removes the inconsistency of individual provisioning decisions. Every new employee and every role change follows the same intelligent standard going forward.
Role intelligence tells you who needs what view. Guidance tells you what to do next. Utilization tells you whether your investment is working. Assignment ensures the foundation is right in the first place.
The result is not just better technology management. It is a measurable improvement in what your business gets from one of its largest investments. Waste is eliminated not because someone went looking for savings — but because good decisions naturally correct inefficiency.
A thirty minute conversation is enough to show you what the platform does and whether it is the right fit for your organization.